Introduction
What is Fitspy
Fitspy is a dedicated tool for spectral fitting — and only for spectral fitting — with the following characteristics:
Agnostic Nature: Fitspy is not tied to any specific physical quantity or database. It is designed to process spectra regardless of their x-support and y-intensity without requiring prior knowledge.
Python Implementation: Fitspy is coded in Python. As a result, spectra can be easily processed using Python scripts, catering to individuals with basic knowledge of the language.
User Models: Fitspy allows users to input their own models either in the form of literal expressions (for simple models) or through Python scripts (for more complex models).
2D Maps: Fitspy has been designed to handle spectra derived from 2D acquisitions. Note that the beyond “2D”, dimensions can encompass time or any other dimension. When dealing with 2D data, an interactive map in the Fitspy GUI allows users to locate and select spectra of interest easily.
Multiprocessing Capabilities: Fitspy enables spectral fit processing on multiple processors, enhancing efficiency.
Constrained Parameters: Leveraging the lmfit library, Fitspy empowers users to impose constraints on parameter ranges or establish constraints between parameters using literal expressions.
Noise level and outliers detection: Fitspy evaluates the background noise of the signal and helps avoid (in a certain scope of use) spending time fitting regions corresponding to simple noise. The same applies regarding outliers (which, for example, could correspond to cosmic rays in certain acquisition domains).
Simple GUI: Fitspy has been designed to be as intuitive and simple to use as possible (subjective criterion).
Therefore, the features of Fitspy make it an ideal tool for quickly fitting a few spectra through its GUI or for fitting several thousand of spectra (or more) by python batches.
Install and launching
Note
Since its 2025.1 version, Fitspy can be launched using two interfaces: one corresponds to the original GUI built with Tkinter, and the other, more recent one, developed using PySide with more ‘flexibility’. As of 2025, both GUIs offer nearly identical features, but future efforts regarding fixes and updates will primarily focus on the PySide GUI.
if python is not already installed in your PC:
Download a python.exe from https://www.python.org/downloads/
Launch the python.exe (ensure to check the box Add python.exe to PATH before proceeding with the installation)
in a command prompt (like cmd or powershell, accessible from the Windows search bar):
For a basic install/upgrade and launching:
pip install fitspy --upgrade
fitspy # to launch the advanced GUI based on PySide
fitspy-tk # to launch the primary GUI based on Tkinter
(If an error message is returned upon executing the first line, it likely indicates that python.exe is not included in your PATHs. In this case, (re)launch your python.exe and choose “modify” to select Add python.exe to PATH)
For a full install with data sets, examples and tests (requiring git):
git clone https://github.com/CEA-MetroCarac/fitspy.git
fitspy # advanced GUI based on PySide
fitspy-tk # primary GUI based on Tkinter

# examples execution
cd fitspy/examples
python ex_gui_auto_decomposition.py
python ex_gui_reload_model.py
...

# tests execution
pip install pytest
cd fitspy
pytest
Quick start
Once the Fitspy GUI has opened,
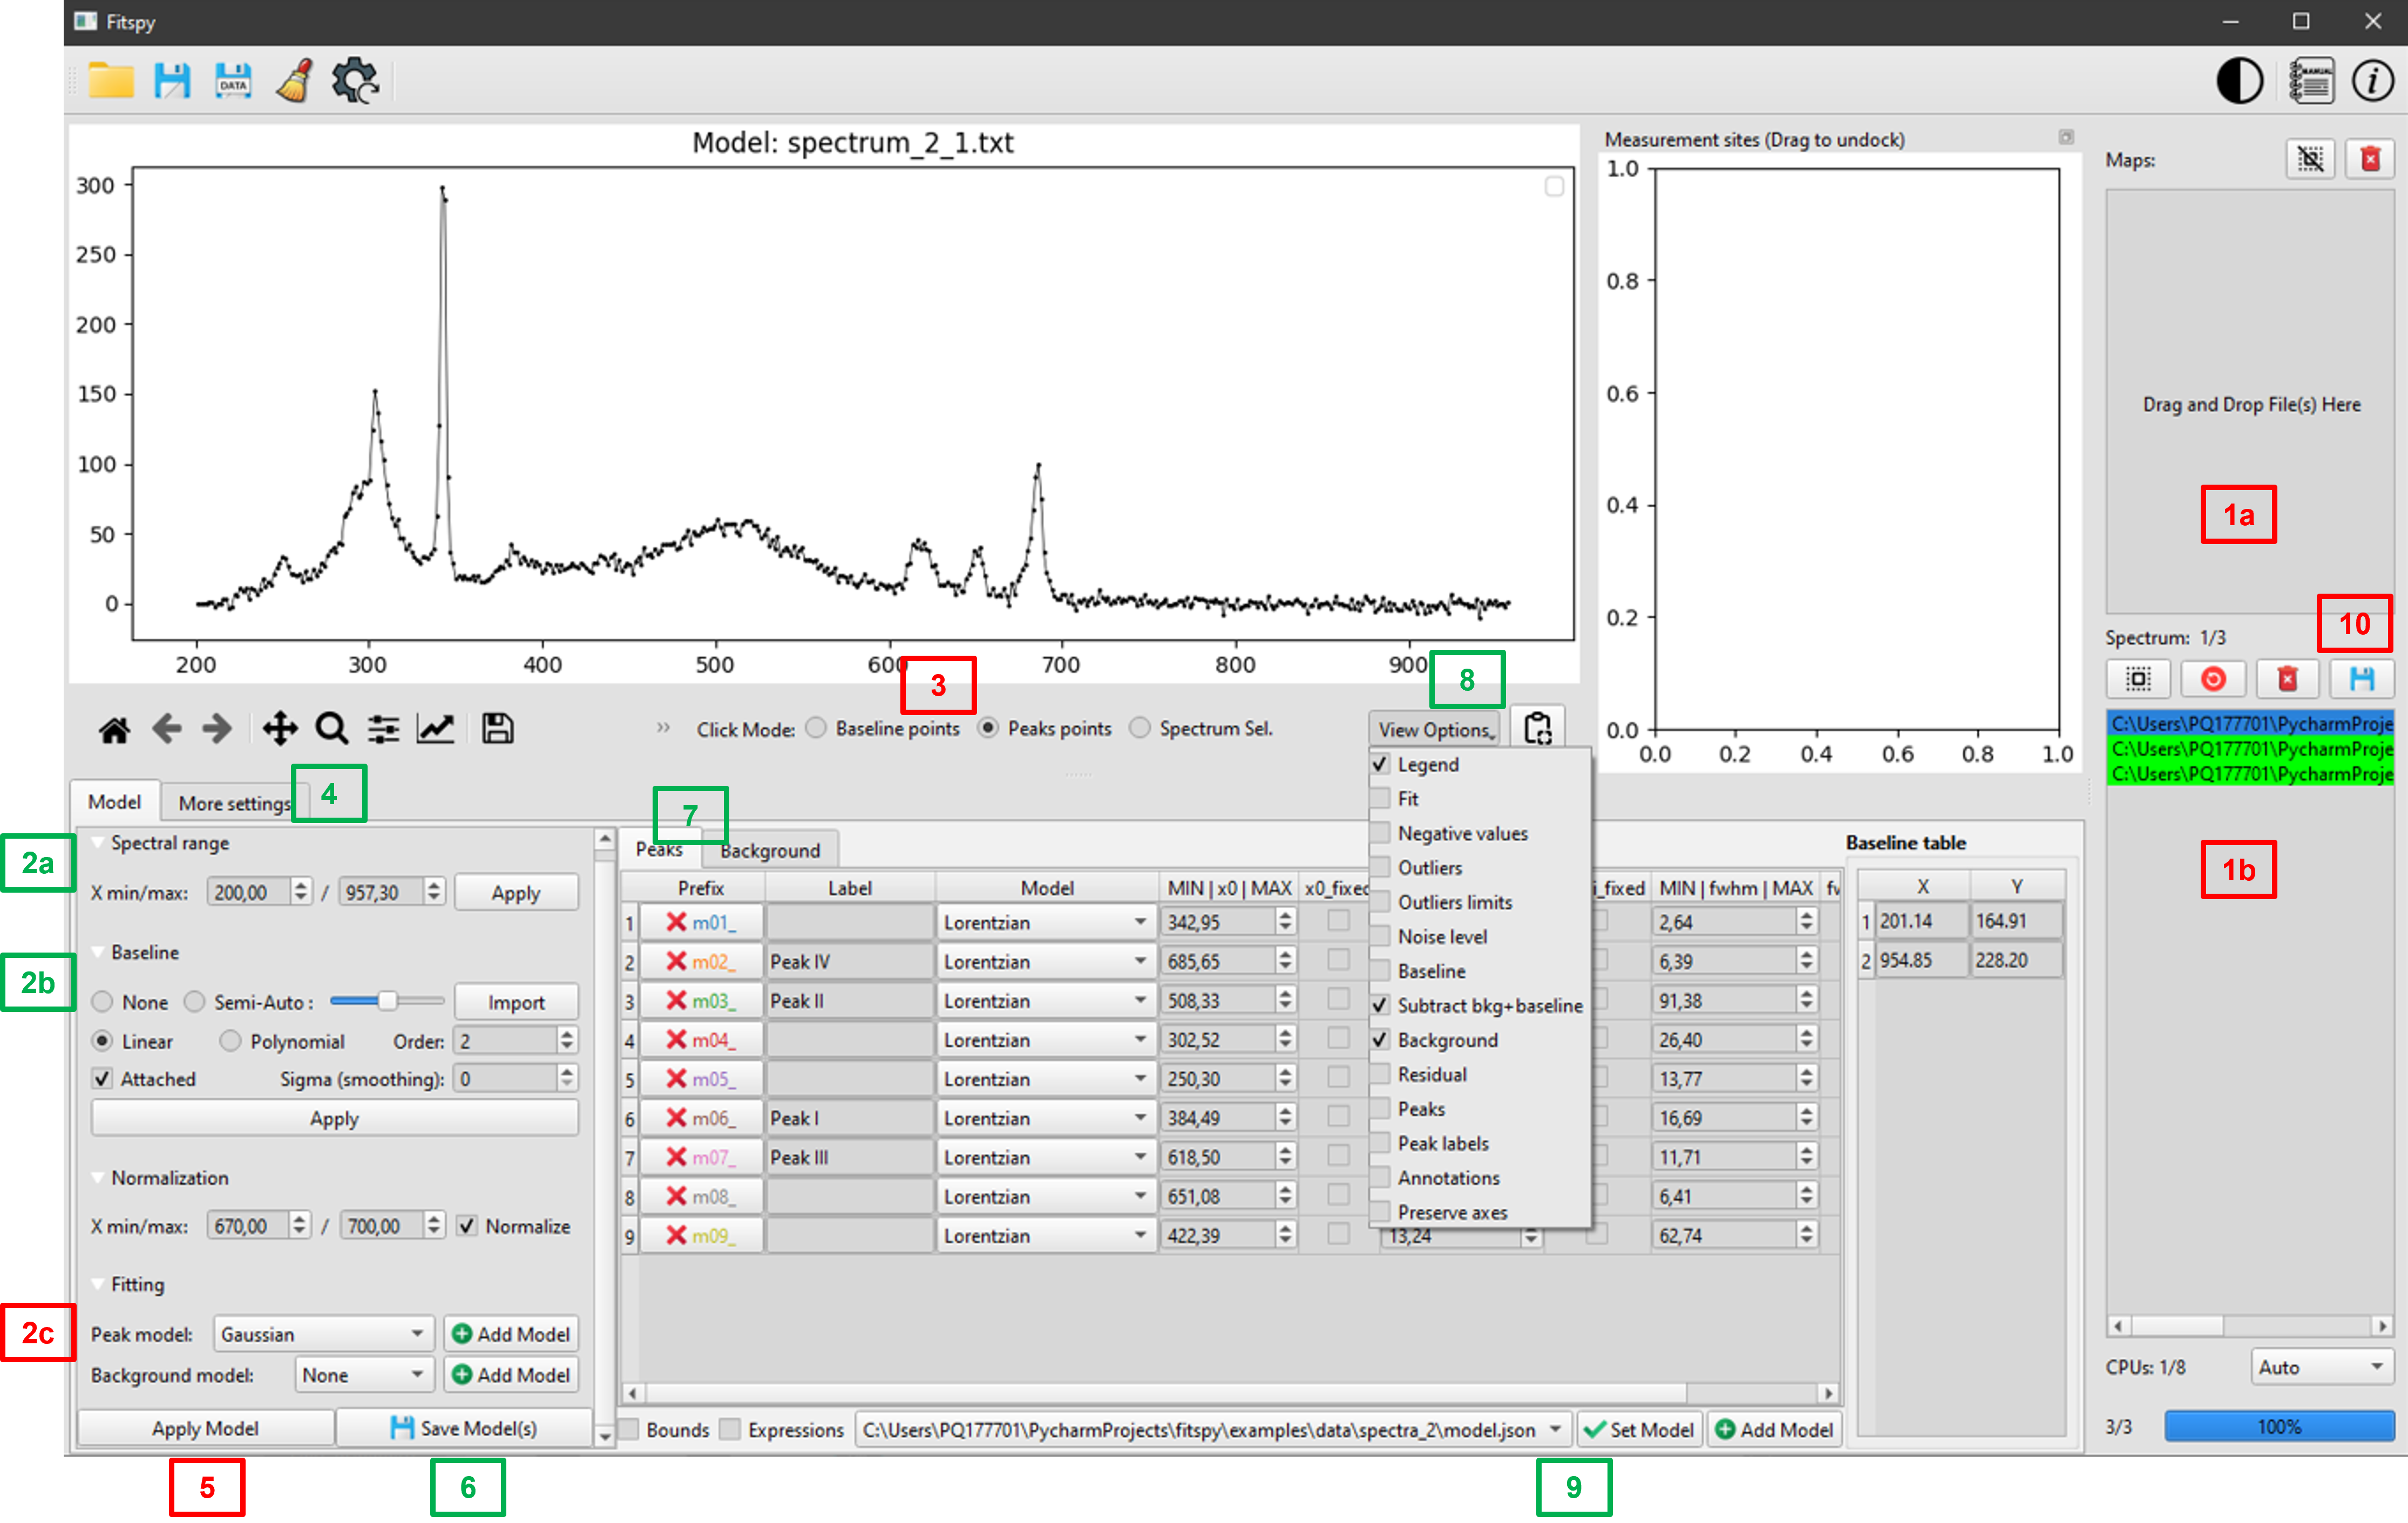
PySide GUI :
The strict minimum operations (in red) for a spectrum fitting consists of:
(1) Select file(s) using drag an drop mode (in the right panel)
(2) Select a
Peak model(3) After clicking on
Peaks points, Select them on the main figure (with left/right click on the figure to add/delete a peak point)Repeat the last two actions as needed
(5)
Fitthe spectrum/spectra selected in the files selector widget(10) Save results (fitted parameters and statistics)
(The entire workflow is described here ).
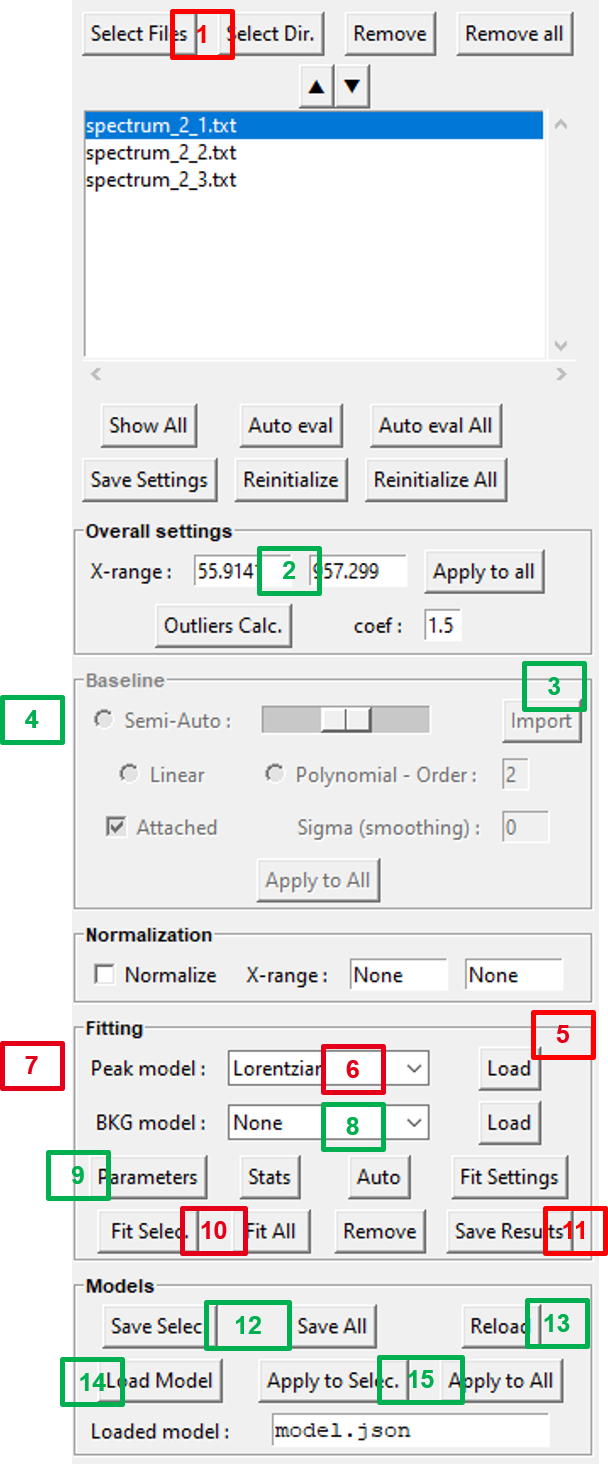
Tkinter GUI :
from top to bottom of the right panel, the strict minimum operations (in red) for a spectrum fitting consists of:
(1) Select file(s) from
Select FilesorSelect Dir(5) Click on the
Fittingpanel to activate it (if not)(6) Select a
Peak model(7) Select a peak point on the main figure (with left/right click on the figure to add/delete a peak point)
Repeat the last two actions as needed
(10)
Fit Selec.the spectrum/spectra selected in the files selector widget orFit Allthe spectra(11)
Save Results(fitted parameters and statistics)
(The entire workflow is described here ).
How Fitspy works
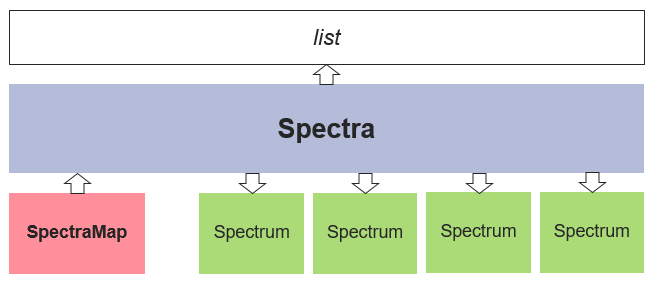
The main class of Fitspy is Spectra (inherited from list) that contains a list of Spectrum objects.
For each of these Spectrum objects, a (x, y) profile is associated. (More details here).
Additionally, 2D maps of spectra (named SpectraMap) that consist in a set of Spectrum with associated grid coordinates can be provided as input according to a dedicated format. (More details here).
The spectra processing are based on BaseLine (optional) and peaks models like Gaussian, Lorentzian, … used to fit the spectra profiles.