fitspy.core package
fitspy.core.baseline module
Class dedicated to spectrum baseline manipulation
- class fitspy.core.baseline.BaseLine
Bases:
objectClass dedicated to spectrum baseline manipulation
- Variables:
points (list of 2 lists) – List of the (x,y) baseline points coordinates
mode (str or None) – Mode used to determine the baseline, among None, ‘arpls’ (semi-automatic baseline determination), ‘Linear’ (piecewise linear decomposition based on users points definition) and ‘Polynomial’. Default mode is None
coef (int) – Smoothing coefficient used in the ‘arpls’ mode. The larger coef is, the smoother the resulting baseline
order_max (int) – Maximum order of the baseline polynomial evaluation
distance (float) – Minimum distance between baseline point to consider when doing automatic detection with ‘Spectrum.auto_baseline’
sigma (float) – Smoothing coefficient (standard deviation) related to a gaussian filtering when defining baseline attached points to the spectrum
attached (bool) – Activation key for attach the baseline points to the spectrum
is_subtracted (bool) – Key used to indicate whether the baseline has been subtracted from the spectrum
y_eval (numpy.ndarray(n)) – The baseline profile resulting from the ‘eval’ function
- reinit()
Reinitialize the main attributes
- add_point(x, y)
Add point in the baseline
- attached_points(x, y)
Return baseline points attached to (x,y) ‘spectrum’ profile coords
- load_baseline(fname)
Load baseline from ‘fname’ with 1 header line and 2 (x,y) columns
- eval(x, y, attached=False)
Evaluate the baseline on a ‘x’ support and a ‘y’ profile possibly smoothed with a gaussian filter
- plot(ax, x, y, attached=False, label='Baseline', show_all=True)
Plot the baseline and its related points
- Parameters:
ax (Matplotlib.Axes) – Axis to work with
x (iterable of floats, optional) – Support to consider for the baseline plotting. If None, create a support from the baseline extrema points
y (iterable of floats, optional) – Values for baseline points attachment (if provided), sharing the same x coordinates
label (str, optional) – Label displays in the figure
show_all (bool, optional) – Activation key to display the primary baseline components (before attachment)
- fitspy.core.baseline.arpls_origin(y, coef=4, ratio=0.05, itermax=10)
Asymmetrically Reweighted Penalized Least Squares smoothing extracted from: https://irfpy.irf.se/projects/ica/_modules/irfpy/ica/baseline.html#arpls
Original article
Sung-June Baek, Aaron Park, Young-Jin Ahna and Jaebum Choo, Analyst, 2015, 140, 250 (2015), https://doi.org/10.1039/C4AN01061B
- param y:
input data (i.e. spectrum intensity)
- type y:
numpy.ndarray(n)
- param coef:
parameter that can be adjusted by user. The larger coef is, the smoother the resulting background, y_smooth
- type coef:
float, optional
- param ratio:
wheighting deviations: 0 < ratio < 1, smaller values allow less negative values
- type ratio:
float, optional
- param itermax:
number of iterations to perform
- type itermax:
int, optional
- returns:
y_smooth (numpy.ndarray(n)) – the fitted background
- fitspy.core.baseline.arpls(y, edge_padding=100, differentiation_order=2, smoothing_factor=10000.0, cvg_tolerance=0.05, max_iterations=10)
Fits a baseline signal to the given spectrum using the Asymmetrically Reweighted Penalized Least Squares algorithm.
This method iteratively fits a smooth baseline to a given spectrum by minimizing the effect of noise while preserving the original signal’s characteristics. The ARPLS algorithm adjusts the baseline by asymmetrically penalizing negative deviations, making it particularly robust for spectral data with varying baseline shapes.
optimized code from: https://stackoverflow.com/questions/78907548/trying-to-optimize-my-arpls-implementation
- Parameters:
y (numpy.ndarray) – The 1D spectrum input array.
edge_padding (int) – Number of points to pad on both ends of the spectrum to improve baseline fitting at the edges. Padding is done using edge values to minimize boundary effects.
differentiation_order (int) – The order of the difference operator used in penalization. An order of 1 enforces a linear baseline (smoothing the first derivative), while an order of 2 enforces a quadratic baseline (smoothing the second derivative). Higher orders allow for more complex baseline shapes.
smoothing_factor (float) – Controls the smoothness of the resulting baseline. Larger values suppress small fluctuations, which may lead to a smoother, but less sensitive baseline.
cvg_tolerance (float) – Convergence criterion based on the change in weights between iterations Must be a value between 0 and 1. Smaller values allow less negative deviations, promoting a more accurate baseline fitting.
max_iterations (int) – Maximum number of iterations to perform. The algorithm iteratively refines the baseline until the convergence criterion is met or the maximum number of iterations is reached.
- Returns:
y_smooth (numpy.ndarray(n)) – The fitted baseline signal array of the same length as the input spectrum (after removing padding).
- fitspy.core.baseline.sonneveld_vesser(y, step=20, c=0.008, niter=10)
Sonneveld–Visser automatic background estimation
- Parameters:
y (numpy.ndarray) – Input spectrum intensity.
step (int, optional) – Subsampling step (default keeps ~5% of points, like Match).
c (float, optional) – Relative clipping threshold (percentage of max background).
niter (int, optional) – Number of clipping iterations.
- Returns:
baseline (numpy.ndarray) – Estimated baseline, interpolated to full resolution.
- fitspy.core.baseline.generate_penalties(shape, differentiation_order, smoothing_factor)
Generates the initial weights and smoothness penalty matrix
fitspy.core.baseline_methods module
fitspy.core.migrations module
fitspy.core.models module
Module containing different basic models (gaussian, lorentzian, …)
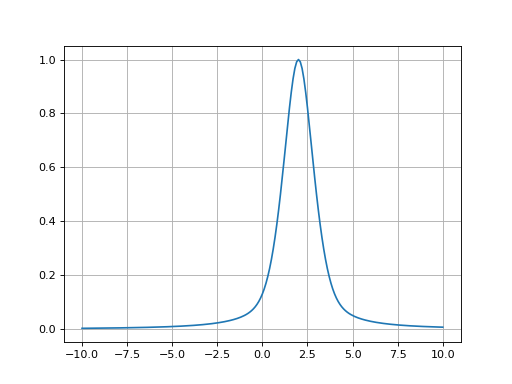
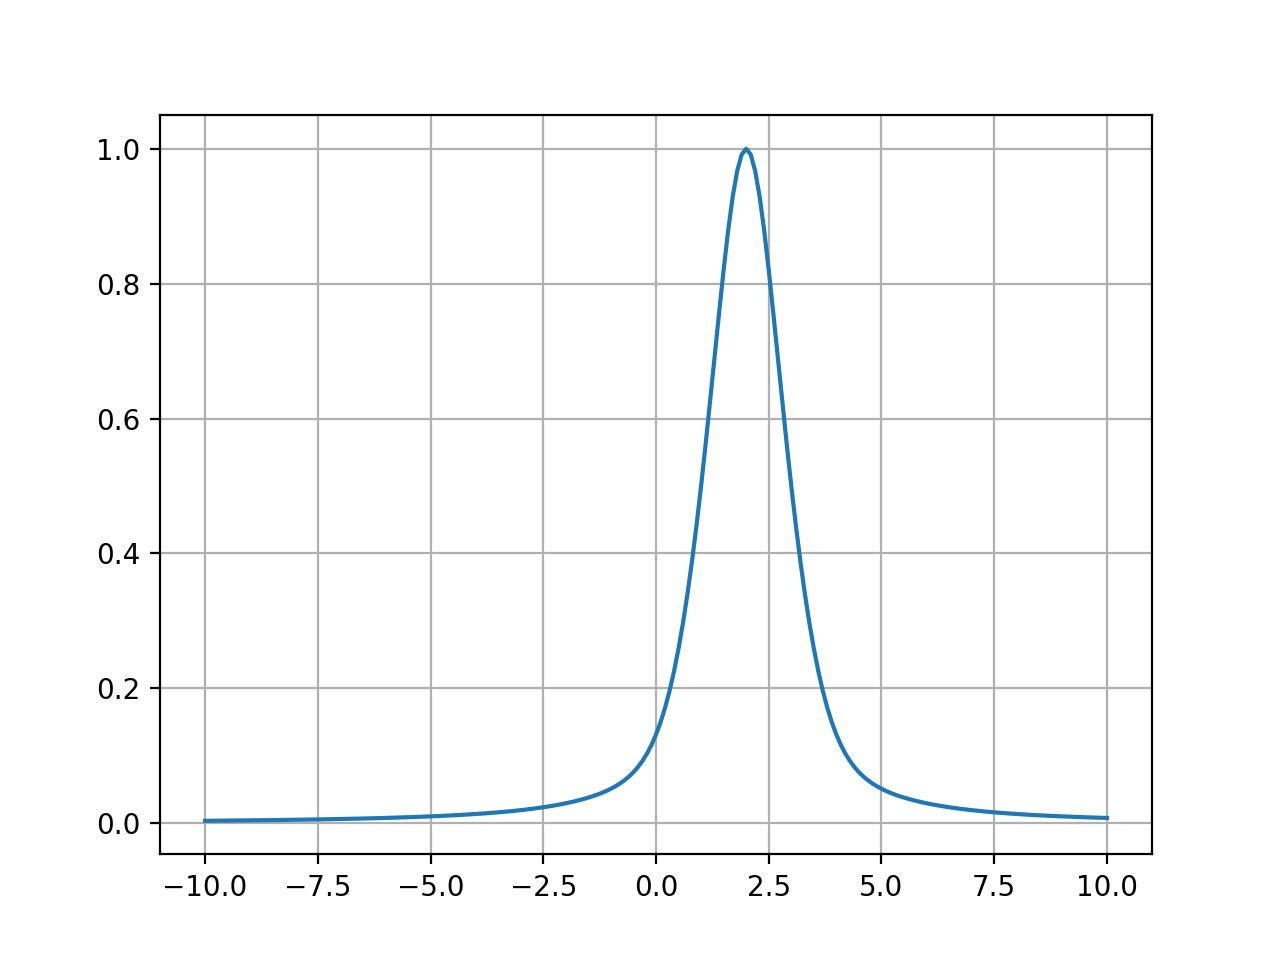
- fitspy.core.models.gaussian(x, ampli, fwhm, x0)
Return Gaussian function defined as: \(ampli * e^{-(x-x0)^2/(2*\sigma^2)}\) with \(\sigma = fwhm / (2*\sqrt{2*log(2)})\)
Example
(
Source code,png,hires.png,pdf)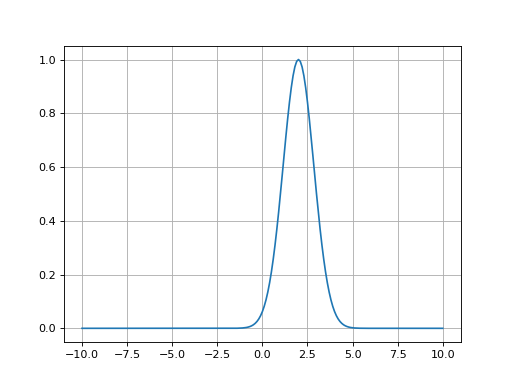
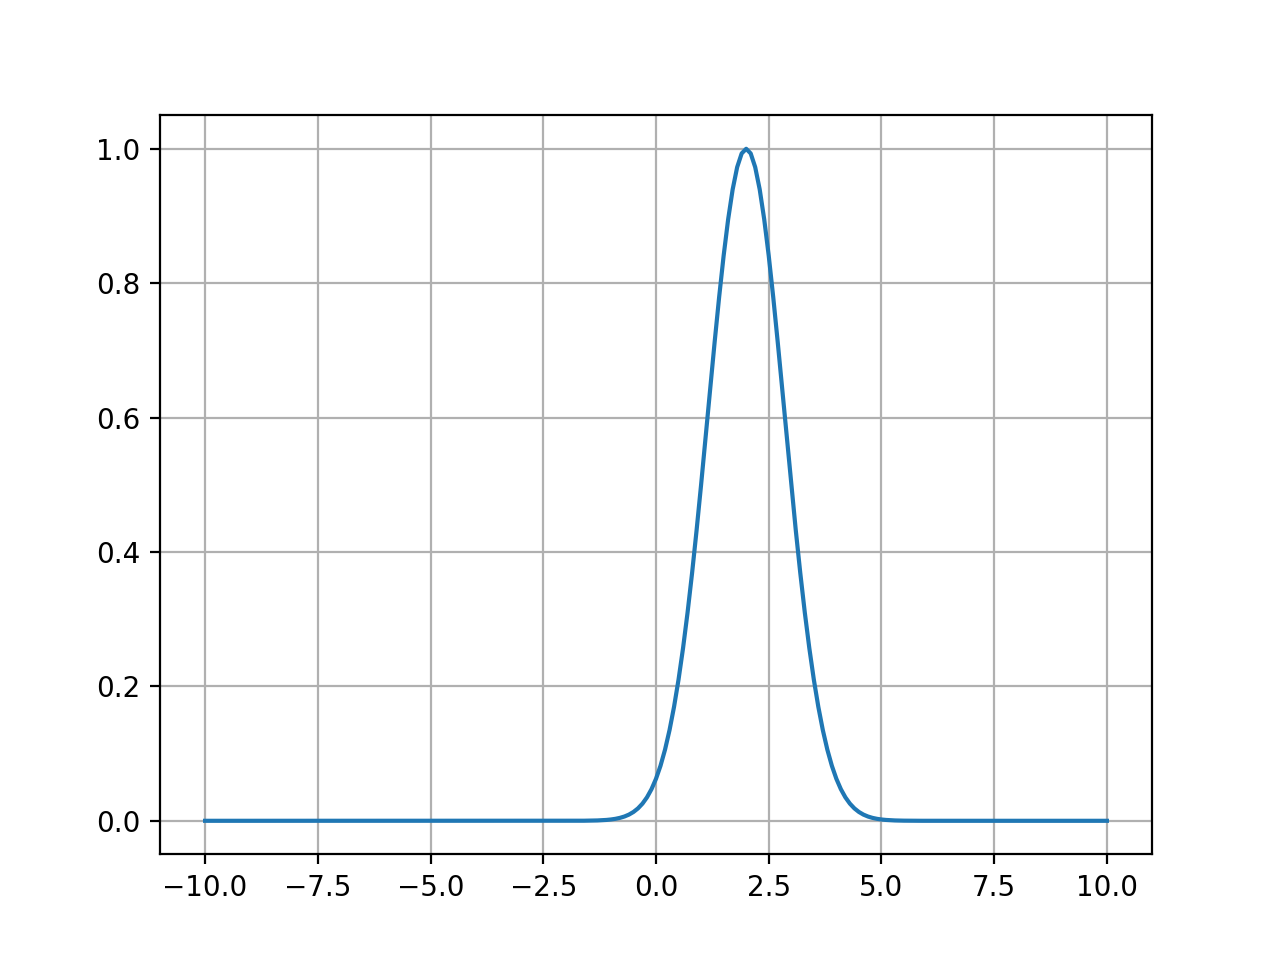
- fitspy.core.models.gaussian_asym(x, ampli, fwhm_l, fwhm_r, x0)
Return Asymmetric Gaussian function defined as: \((x < x0) * Gaussian(fwhm\_l) + (x >= x0) * Gaussian(fwhm\_r)\)
Example
(
Source code,png,hires.png,pdf)
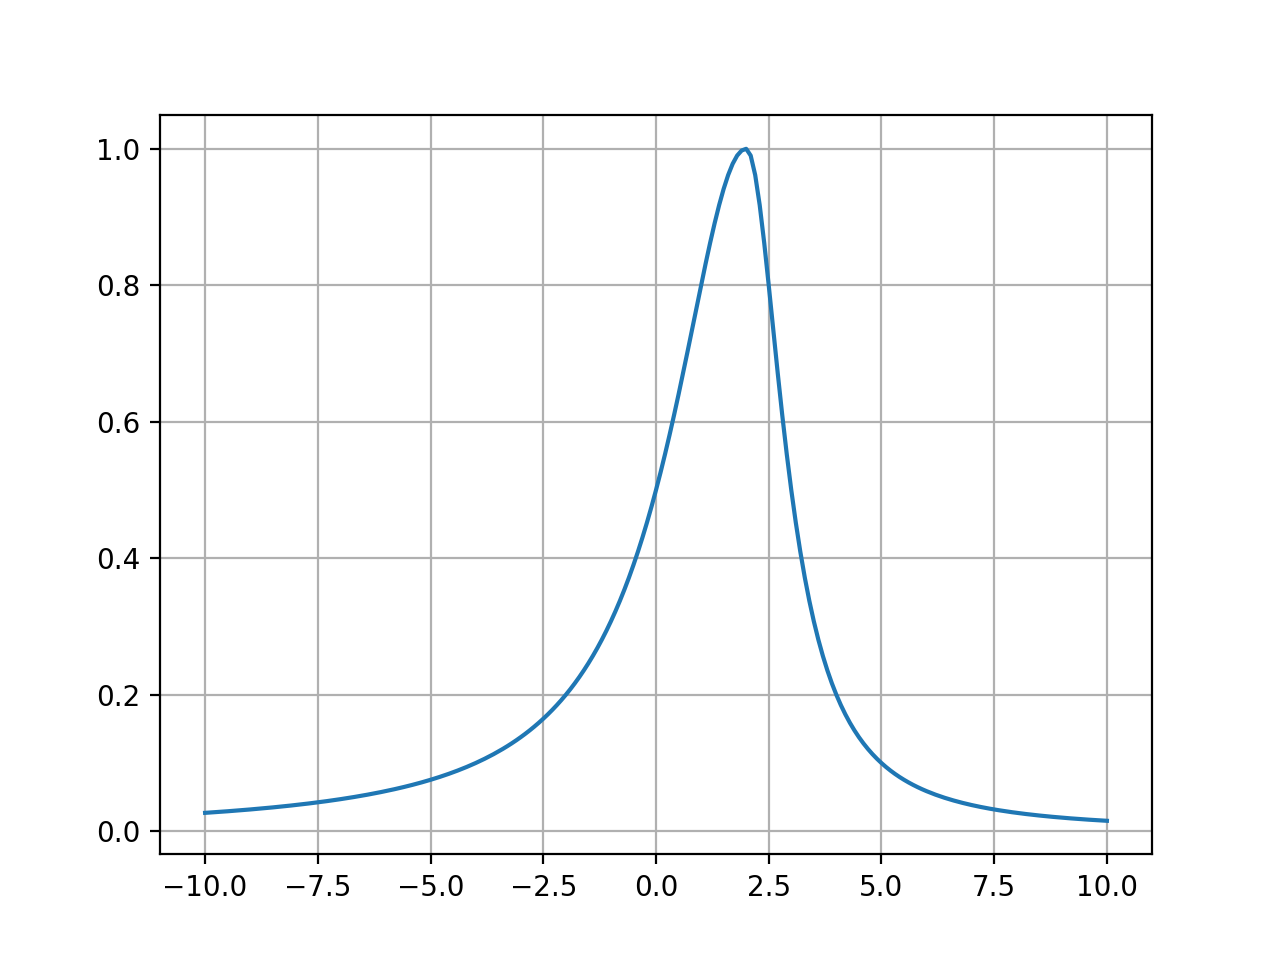
- fitspy.core.models.lorentzian(x, ampli, fwhm, x0)
Return Lorentzian function defined as: \(ampli * \frac{fwhm^2}{4 * ((x - x0)^2 + fwhm^2 / 4)}\)
Example
(
Source code,png,hires.png,pdf)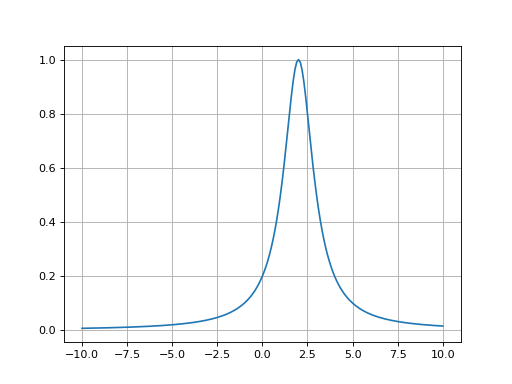
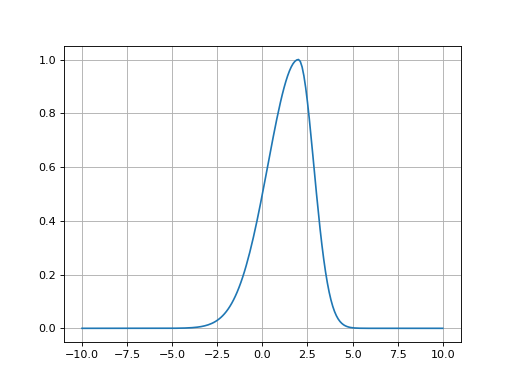
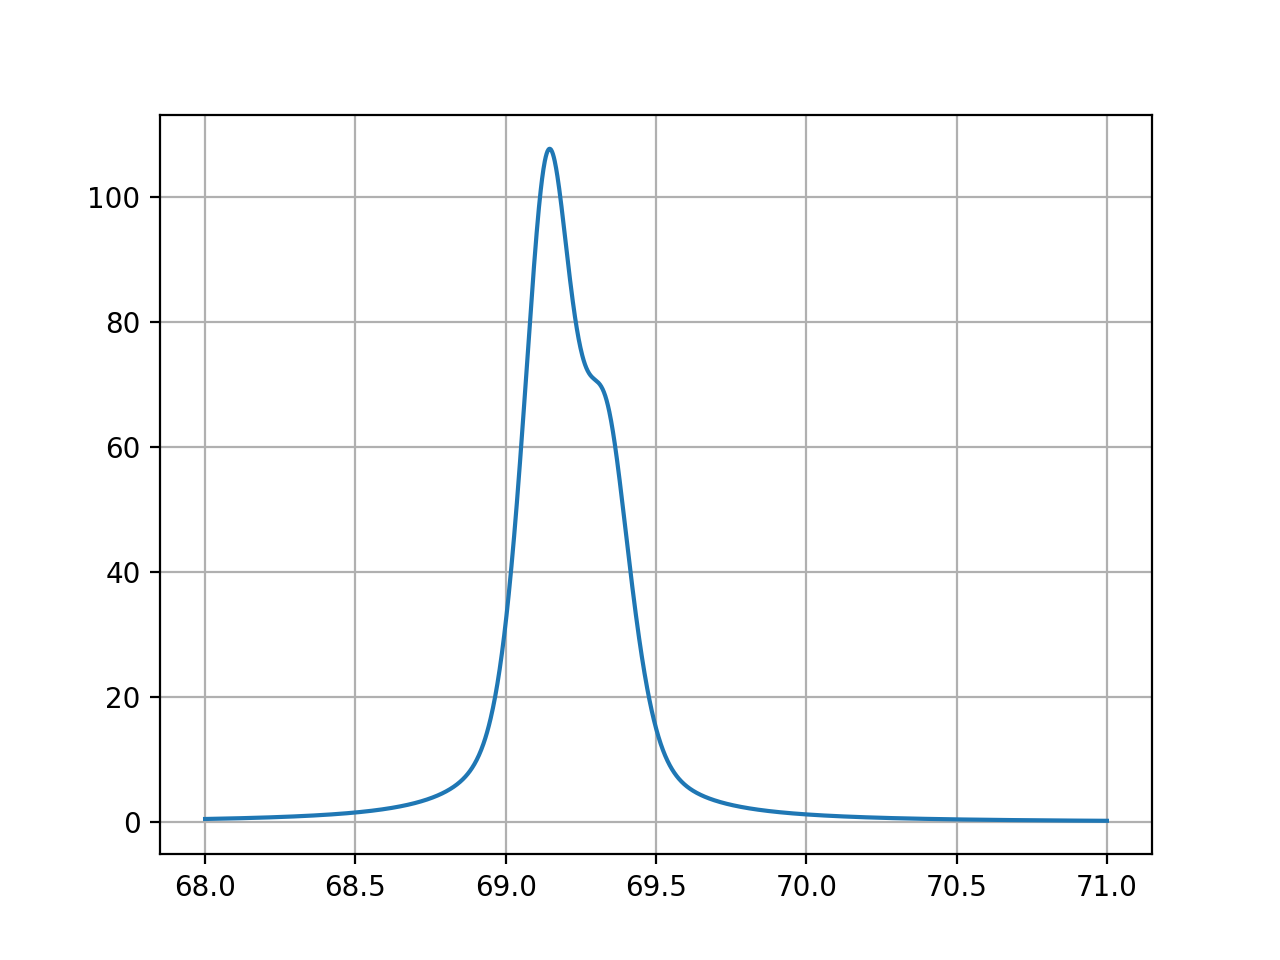
- fitspy.core.models.lorentzian_asym(x, ampli, fwhm_l, fwhm_r, x0)
Return Asymmetric Lorentzian function defined as: \((x < x0) * Lorentzian(fwhm\_l) + (x >= x0) * Lorentzian(fwhm\_r)\)
Example
(
Source code,png,hires.png,pdf)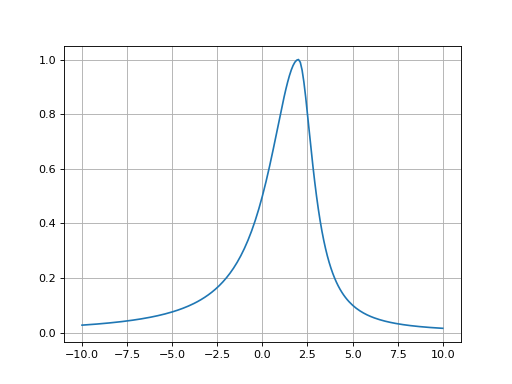
- fitspy.core.models.pseudovoigt(x, ampli, fwhm, x0, alpha=0.5)
Return Pseudovoigt function defined as: \(alpha * Gaussian + (1 - alpha) * Lorentzian\)
Example
(
Source code,png,hires.png,pdf)
fitspy.core.models_bichromatic module
Module related to bichromatic models
- fitspy.core.models_bichromatic.pseudovoigt_ka12(x, ampli, fwhm, x0, alpha=0.5, cathode='Cu', coefs=None)
Return a double Pseudovoigt function often used in X-Ray Diffraction when using a lab source delivering a bichromatic beam. When deriving Bragg law for both wavelength. The position of the Ka2 peak is fully determined by the Ka1 one. For sake a simplicity, fwhm2 is set to fwhm (minor approximation).
\[2d_{hkl} \sin \theta_{1} = \lambda_{Ka1} \quad 2d_{hkl} \sin \theta_{2} = \lambda_{Ka2} \quad \sin \theta_{2} = \frac{\lambda_{Ka2}}{\lambda_{Ka1}} \sin \theta_{1}\]The ratio between wavelengths depends on the cathode element (Cu, Mo, Ag, Co…).
- Parameters:
x (ndarray) – ‘2θ’ angles in degree or ‘qx’ (depending on ‘MODE’)
ampli (float) – amplitude of the pseudo-Voigt
fwhm (float) – width of the pseudo-Voigt
x0 (float) – center of the pseudo-Voigt
alpha (float) – gaussian weight of the pseudo-Voigt
cathode (str) – element of the X-ray source cathode
coefs (iterable of 2 floats, optional) – coefficients applied to each peak contribution. Default values are (1, 1)
Example
(
Source code,png,hires.png,pdf)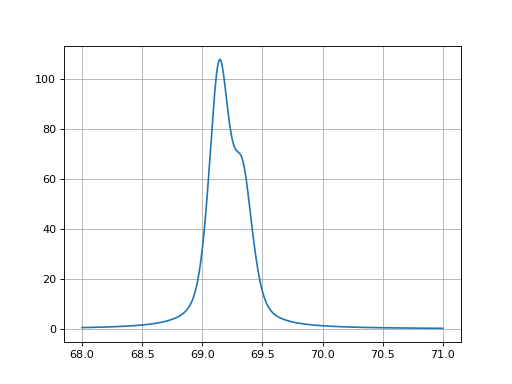
- fitspy.core.models_bichromatic.make_pseudovoigt_ka12_for(cathode)
Return function associated with the ‘given’ cathode
- fitspy.core.models_bichromatic.add_models()
Add bichromatic models in the PEAK_MODELS list
- fitspy.core.models_bichromatic.plot_decomposition(ax, model, x, params, lw=None, color=None)
Plot each peak contribution
fitspy.core.spectra module
Class dedicated to handle ‘Spectrum’ objects contained in a list managed by “Spectra”
- class fitspy.core.spectra.Spectra(spectra_list=None, fnames=None)
Bases:
listClass dedicated to handle ‘Spectrum’ objects contained in a list
- Variables:
spectra_maps (list of SpectraMap objects) –
pbar_index (int) – Index related to the Progress bar during the fit processing
- Parameters:
spectra_list (list of Spectrum objects, optional) –
fnames (list of str, optional) – List of spectra pathname
- property fnames
Return all the fnames related to spectra AND spectra maps
- property all
Return all the spectra related to spectra AND spectra maps
- intensity()
Return the raw intensity array related to spectra AND spectra maps
- get_spectrum(fname)
Return spectrum from ‘fname’ contained in the ‘spectra’ list only
- get_objects(fname)
Return spectrum and parent (spectra or spectra map) related to ‘fname’
- outliers_limit_calculation(coef=1.5, nmax=5)
Calculate the outliers limit from ‘coef’ * intensity_ref
- save_results(dirname_res, fnames=None)
Save spectra results (peaks parameters and statistics) in .csv files
- Parameters:
dirname_res (str or pathlib.Path object) – Dirname where to save the .csv files
fnames (list of str, optional) – List of the spectrum ‘fnames’ to save. If None, consider all the spectrum contained in the ‘spectra’ list
- save_figures(dirname_fig, fnames=None, bounds=None)
Save spectra figures
- Parameters:
dirname_fig (str or pathlib.Path object) – Dirname where to save the figures
fnames (list of str, optional) – List of the spectrum ‘fnames’ to save. If None, consider all the spectrum contained in the ‘spectra’ list
bounds (tuple of 2 tuples, optional) – Axis limits corresponding to ((xmin, xmax), (ymin, ymax))
- static load_model(fname_json, ind=0)
Return a fitspy model (‘model_dict’) from a ‘.json’ file
- Parameters:
fname_json (str) – Filename associated to the spectra .json file where to extract the fitspy model
ind (int, optional) – Spectrum index to consider as model in the spectra issued from the .json file reloading
- Returns:
model_dict (dict) – The corresponding fitspy model
- apply_model(model, fnames=None, ncpus=1, show_progressbar=True)
Apply ‘model’ to all or part of the spectra
- Parameters:
model (str or dict) – filename to a Fitspy model (‘.json’ file) or Dictionary related to the Spectrum object attributes (obtained from Spectrum.save() for instance) to be applied
fnames (list of str, optional) – List of the spectrum.fname to handle. If None, apply the model to all the spectra
ncpus (int, optional) – Number of CPU to use during the fit processing
show_progressbar (bool, optional) – Activation key to show the progress bar
- progressbar(queue_incr, ntot, ncpus, show_progressbar)
Progress bar
- save(fname_json=None, fnames=None, save_data=False)
Return a ‘dict_spectra’ dictionary with all the spectrum attributes (but objects) and Save it in a .json file if a ‘fname_json’ is given
- Parameters:
fname_json (str, optional) – Filename associated to the .json file for the spectra saving
fnames (list of str, optional) – List of the spectrum ‘fnames’ to save. If None, consider all the spectrum contained in the ‘spectra’ list
save_data (bool, optional) – Activation keyword to write spectra/spectramap values at the end of the dictionary
- Returns:
dict_spectra (dict) – Dictionary with all the spectrum attributes but objects, and input data if ‘save_data’ is set to True
- static load(fname_json=None, dict_spectra=None, preprocess=False)
Return a Spectra object from a .json file or directly from ‘dict_spectra’
- set_attributes(dict_spectra, preprocess=False)
Set attributes to spectrum object related to ‘dict_spectra’
fitspy.core.spectra_map module
Class dedicated to handle ‘Spectrum’ objects from a 2D map managed by SpectraMap
- class fitspy.core.spectra_map.SpectraMap
Bases:
SpectraClass dedicated to handle ‘Spectrum’ objects from a 2D map
- Variables:
fname (str) – Pathname associated to the loaded object
arr0 (numpy.ndarray) – Raw array with coordinates and intensities returned by fitspy.core.utils.get_2d_map()
xy_map (tuple of 2 list) – Lists of x and y coordinates used in the 2D-map
shape_map (tuple of 2 ints) – Shape associated to the 2D-map
extent (iterable of 4 floats) – bounding box in data coordinates that the image will fill specified as (xmin, xmax, ymin, ymax)
coords (list of list of 2 floats) – List containing the (x,y) coordinates for each spectrum in the 2D-map
fnames_map (list of str) – List of the spectrum names related to the 2D-map
intensity (numpy.ndarray(((len(shape_map[0]) * len(shape_map[1]), n))) – Array of spectra intensities (n-values) associated to the xy_map coords
arr (numpy.ndarray((len(shape_map[0]), len(shape_map[1]))) – Array associated to the xy_map coords
ax (Matplotlib.pyplot.axis) – Axis associated to the 2D-map displaying
img (Matplotlib.image.AxesImage) – Image related to the 2D-map displaying
cbar (Matplotlib.pyplot.colorbar) – Colorbar associated to the spectra 2D-map displaying
ax_slider (Matplotlib.pyplot.axis) – Axis associated to the RangeSlider object
slider (Matplotlib.widgets.RangeSlider) – Slider associated to the intensity integration range or to a model parameter in the 2D-map displaying
xrange (tuple of 2 floats) – Range of intensity to consider in the 2D-map displaying
marker (matplotlib.lines.Line2D) – Maker used in the 2D-map axis to set a spectrum position
- create_map(fname, arr0=None)
Create map
- get_spectrum(fname)
Return the spectrum object related to ‘fname’ in the spectra map list
- static spectrum_coords(spectrum)
Return the (x, y) map coordinates associated with ‘spectrum’
- spectrum_indices(spectrum)
Return the (i, j) map indices associated with ‘spectrum’
- plot_map(ax, range_slider=None, cmap='viridis')
Plot the integrated spectra map intensities on ‘ax’
- plot_map_update(xrange=None, var='Intensity', label='', vmin=None, vmax=None, cmap=None)
Update ‘plot_map’ with intensity or models parameter passed through ‘var’ and ‘label’, and apply a custom colormap if provided.
- set_marker(spectrum_id, canvas=None)
Set a marker on the plot.
- Parameters:
spectrum_id (Spectrum object, str or a tuple of 2 floats) – a Spectrum object or its filename ‘fname’ or its (x, y) coordinates
- Returns:
None if spectrum_id is a spectrum object or a spectrum fname.
A string corresponding to “{fname} X={x} Y={y}” if spectrum_id is a tuple (x, y).
- export_to_csv(fname)
Export ‘arr’ class attribute in a .csv file named ‘fname’
- static load_map(fname, arr0=None)
Return a SpectraMap object from a .txt file issued either from the labspec file conversion or from the corresponding array ‘arr0’ previously saved and reloaded
fitspy.core.spectrum module
Class dedicated to spectrum processing
- fitspy.core.spectrum.create_model(model, model_name, prefix=None)
Return a ‘model’ (peak_model or ‘bkg_model’) object
- class fitspy.core.spectrum.Spectrum
Bases:
objectClass dedicated to spectrum processing
- Variables:
fname (str) – Filename associated to spectrum to handle
range_max (range_min,) – Range associated to the spectrum support to work with
y0 (x0,) – Arrays related to the spectrum raw support and intensity (resp.)
y (x,) – Arrays related to spectrum modified support and intensity (resp.)
normalize (bool) – Activation keyword for the spectrum profile normalization
normalize_range_max (normalize_range_min,) – Ranges for searching the maximum value used in the normalization
outliers_limit (numpy.array((n0))) – Array related to the outliers limit associated to the raw data (x0, y0)
outliers_inds (list of int) – Indices related to (extra) users-defined outliers
baseline (Baseline object) – Baseline associated to the spectrum (to subract)
baseline_history (list of list - DEPRECATED from v2024.2) – Concatenation list of all baselines applied to the spectrum. Each item of the list consist in the max order of the baseline polynom and the (x, y) baseline points coordinates.
bkg_model (lmfit.Model) – Background model to fit with the composite peaks models, among : [None, ‘ConstantModel’, ‘LinearModel’, ‘ParabolicModel’, ‘ExponentialModel’, ‘PowerLaw’]
peak_models (list of lmfit.Model) – List of peak models
peak_labels (list of str) – List of labels associated to the peak models. Default is [‘1’, ‘2’, …]
peak_index (itertools.count) – Counter used for peak models indexing when creating a lmfit.Model
fit_params (dict) –
Dictionary used to manage the fit parameters: * method: str
Method used for fitting. See lmfit.Model.fit(). Default method is ‘Leastsq’.
- fit_negative: bool
Activation keyword to take into account negative values when fitting. Default is False.
- fit_outliers: bool
Activation keyword to take into account outliers points when fitting. Default is False.
- max_ite: int
Maximum number of iteration associated to the fitting process. An iteration consists in evaluating all the ‘free’ parameters once. Default is 200.
- coef_noise: float
Coefficient applied to the estimated noise amplitude to define a threshold below which the mask values are set to False, and local peak models are disabled. Default is 2.
- xtol: float
Relative error desired in the solution approximated by the ‘Leastsq’ or the ‘Least_square’ algorithm. Default is 1e-4.
- independent_models: bool
Key to fit each model of the composite model separately. Default value is False.
result_fit (lmfit.ModelResult) – Object resulting from lmfit fitting. Default value is a ‘None’ object (function) that enables to address a ‘result_fit.success’ status.
- reinit()
Reinitialize the main attributes
- set_attributes(model_dict)
Set attributes from a dictionary (obtained from a .json reloading)
- preprocess()
Preprocess the spectrum: call successively load_profile(), apply_range(), eval_baseline(), subtract_baseline() and normalization()
- load_profile(fname)
Load profile from ‘fname’ with 1 header line and 2 (x,y) columns
- dx(x0=None)
Return the local mean step size (dx) according to uniform_filter1d()
- inds_local_minima()
Return indexes of local minima obtained after smoothing
- apply_range(range_min=None, range_max=None)
Apply range to the raw spectrum
- calculate_outliers()
Return outliers points (x,y) coordinates
- property y_no_outliers
Return spectrum profile where outliers have been removed and replaced by interpolated values
- normalization()
Normalize spectrum according to the ‘Maximum’ value or the nearest ‘Attractor’ value from reference position, assuming that the baseline has been correctly defined (y_min value ~ 0)
- static create_peak_model(index, model_name, x0, ampli, fwhm=1.0, fwhm_l=1.0, fwhm_r=1.0, alpha=0.5, dx0=[-20.0, 20.0], dfwhm=200.0)
Create a ‘lmfit’ model associated to one peak
- Parameters:
index (int) – Index used to create the ‘prefix’ associated to the peak model
model_name (str) – Model name among ‘Gaussian’, ‘Lorentzian’, ‘PseudoVoigt’, ‘GaussianAsym’, ‘LorentzianAsym’
x0 (float) – Position of the peak model
ampli (float) – Amplitude of the peak model.
fwhm (floats, optional) – Optional parameters passed to the model related to the Full Width at Half Maximum. Default values are 1.
fwhm_l (floats, optional) – Optional parameters passed to the model related to the Full Width at Half Maximum. Default values are 1.
fwhm_r (floats, optional) – Optional parameters passed to the model related to the Full Width at Half Maximum. Default values are 1.
alpha (float, optional) – Optional parameter passed to the ‘PseudoVoigt’ model. Default value is 0.5.
dx0 (tuple of 2 floats, optional) – Bounds associated with x0 such as x0 is in [x0-dx0[0]; x0+dx0[1]]. Default value is 20.
dfwhm (float, optional) – Upper bound allowed for fwhm / fwhm_l /fwhm_r. fwhm_ in [0; dfwhm]
- Returns:
peak_model (lmfit.Model)
- reassign_params()
Reassign fitted ‘params’ values to the ‘models’
- estimate_params(x0)
Return model parameters estimated from the local spectrum profile
- add_peak_model(model_name, x0, ampli=None, fwhm=None, fwhm_l=None, fwhm_r=None, alpha=0.5, dx0=None, dfwhm=None)
Add a peak model passing model_name and indice position or parameters
- Parameters:
model_name (str) – Model name among ‘Gaussian’, ‘Lorentzian’, ‘GaussianAsym’, ‘LorentzianAsym’, …
x0 (float) – Position of the peak model
ampli (float, Optional) – Amplitude of the peak model. If None, consider the amplitude of the spectrum profile at position x0.
fwhm (floats, optional) – Full Width(s) at Half Maximum passed to the model. Default value are based on local estimations related to the spectrum profile.
fwhm_l (floats, optional) – Full Width(s) at Half Maximum passed to the model. Default value are based on local estimations related to the spectrum profile.
fwhm_r (floats, optional) – Full Width(s) at Half Maximum passed to the model. Default value are based on local estimations related to the spectrum profile.
alpha (float, optional) – Optional parameter passed to the ‘PseudoVoigt’ model. Default value is 0.5.
dx0 (tuple of 2 floats, optional) – Bounds associated with x0 such as x0 is in [x0-dx0[0]; x0+dx0[1]]. Default value is based on a local estimation related to the spectrum profile.
dfwhm (float, optional) – Upper bound allowed for fwhm / fwhm_l /fwhm_r. fwhm_ in [0; dfwhm] Default value are based on local estimations related to the spectrum profile.
- del_peak_model(i)
Delete the ith-peak model
- reorder(key='x0', reverse=False)
Return increasing or decreasing ordered models list from ‘key’
- static get_model_name(model)
from model class attribute return the function name associated Ex: Model(‘LorentzianAsym’…) -> ‘lorentzian_asym’
- remove_models()
Remove all the models
- set_bkg_model(bkg_name)
Set the ‘bkg_model’ attribute from ‘bkg_name’
- fit(fit_method=None, fit_negative=None, fit_outliers=None, independent_models=None, max_ite=None, coef_noise=None, xtol=None, reinit_guess=True, **kwargs)
Fit the peaks and background models
- Parameters:
fit_method (str, optional) – Method passed to lmfit.fit() like ‘leastsq’, ‘least_squares’, ‘nelder’, ‘slsqp’, … (see the lmfit documentation). Default value is ‘leastsq’.
fit_negative (bool, optional) – Activation key to take into account negative values during the fit. Default value is False.
fit_outliers (bool, optional) – Activation key to take into account outliers during the fit. Default value is False.
independent_models (bool, optional) – Key to fit each model of the composite model separately. Default value is False.
max_ite (int, optional) – Number of maximum iterations (1 iteration corresponds to 1 gradient descent of all the variables). Default value is 200.
coef_noise (float, optional) – Multiplication factor associated with the estimated noise level. Default value is 1.
xtol (float, optional) – Relative tolerance associated with the ‘leastsq’ and the ‘least_squares’ fit algorithm. Default value is 0.0001.
reinit_guess (bool, optional) – Key to adapt initial values for ‘ampli’ and ‘fwhm’, ‘fwhm_l’ or ‘fwhm_r’ to the spectrum intensity at the corresponding point ‘x0’. Default value is True.
kwargs (dict, optional) – Dictionary of optional arguments passed to lmfit.fit()
- auto_baseline()
set baseline.mode to ‘arpls
- eval_baseline()
Evaluate baseline profile
- subtract_baseline()
Subtract the baseline to the spectrum profile
- auto_peaks(model_name)
Create automatically ‘model_name’ peak-models in the limit of 5% of the maximum intensity peaks and nmax_nfev=400
- eval_outliers(subtract_baseline=False)
Return outliers points (x,y) coordinates for plotting
- eval_xy(subtract_baseline=False, subtract_bkg=False)
Return spectrum (x,y) coordinates for plotting
- plot(ax, show_weights=True, show_outliers=True, show_outliers_limit=True, show_negative_values=True, show_noise_level=True, show_baseline=True, show_background=True, show_peak_models=True, show_peak_decomposition=True, show_result=True, subtract_baseline=True, subtract_bkg=True, label=None, kwargs=None, cmap_peaks=None)
Plot the spectrum with the peak models
- plot_residual(ax, factor=1)
Plot the residual x factor obtained after fitting
- save_profiles(dirname_profiles)
Save profiles in a ‘.csv’ file located in ‘dirname_params’
- save_params(dirname_params)
Save fit parameters in a ‘.csv’ file located in ‘dirname_params’
- save_stats(dirname_stats)
Save statistics in a ‘.txt’ file located in ‘dirname_stats’
- save(fname_json=None, save_data=False)
Return a ‘model_dict’ dictionary from the spectrum attributes and Save it if a ‘fname_json’ is given
- static load(fname_json, preprocess=False)
Return a Spectrum object created from a .json file reloading
- static create_from_model(fname, num_points=1000)
Create a dummy spectrum with appropriate x-range based on model parameters
fitspy.core.utils module
utilities functions
- fitspy.core.utils.closest_item(element_list, value)
Return the closest element in the given list
- fitspy.core.utils.closest_index(element_list, value)
Return the closest element index in the given list
- fitspy.core.utils.hsorted(list_)
Sort the given list in the way that humans expect
- fitspy.core.utils.fileparts(filename)
Returns different file parts of a file
fileparts(r”toto/tata/tutu.xyz”) >> (‘tototata’, ‘tutu’, ‘.xyz’) fileparts(r”toto/tata/tutu X=12.3 Y=56.7”) >> (‘tototata’, ‘tutu X=12.3 Y=56.7’, None)
- fitspy.core.utils.check_or_rename(filename, add=0)
Return filename with increment xx_{add}.yy if file access is denied
- fitspy.core.utils.load_from_json(filename)
Load a dictionary from a ‘.json’ file
- Parameters:
filename (str) – Pathname of the .json file
- Returns:
a dict object
- fitspy.core.utils.save_to_json(filename, dictionary, indent=3)
Function to save dictionary in a ‘.json’ file with a compact format
- Parameters:
filename (str) – Pathname of the .json file
dictionary (dict object) – The dictionary to save
indent (int, optional) – json keyword for indentation. See dedicated doc for more details
- fitspy.core.utils.compress(array)
Return a dict from a numpy array, compressed and encoded to a base64 string, to be decompressed later
- fitspy.core.utils.decompress(data)
Decode and decompress a base64 string to a numpy array from a ‘data’ dictionary produced by the compress() function
- fitspy.core.utils.load_models_from_txt(fname, MODELS)
Load models from ‘.txt’ file
- Parameters:
fname (str or WindowsPath) – Filename of the .txt file with the models expressions: model_name1 = expression1 model_name2 = expression2
MODELS (dict) – Dictionary corresponding to fitspy.PEAK_MODELS or fitspy.BKG_MODELS
- fitspy.core.utils.load_models_from_py(fname)
Load models from ‘.py’ file (See the documentation for more details)
- fitspy.core.utils.get_dim(fname)
Return the dimension (1, 2 or None) of the spectrum/spectra field
- fitspy.core.utils.get_reader_from_rsciio(fname)
Return the reader object using the Rosettasciio library
- fitspy.core.utils.get_x_data_from_rsciio(fname)
Return the spectrum/spectra support (‘x’) and the related intensities (‘data’) using the Rosettasciio library
- fitspy.core.utils.get_x_data_from_nxcansas(fname)
Return the spectrum support (‘data_x’) and the related intensities (‘data_y’) considering NXcanSAS data format
- fitspy.core.utils.get_1d_profile(fname)
Return the spectrum support (‘x0’) and its intensity (‘y0’)
- fitspy.core.utils.get_2d_map(fname)
Return the array related to a 2D-map. For more details about the array shape, see: https://cea-metrocarac.github.io/fitspy/user_guide/input_data.html#d-map-spectra”
- fitspy.core.utils.eval_noise_amplitude(y)
Evaluate the noise amplitude wrt oscillations at every other point
- fitspy.core.utils.with_independent_vars(*vars)
Attach _independent_vars to a function as decorator
fitspy.core.utils_mp module
utilities functions related to multiprocessing
notes: The strategy (see commented lines below) of passing the models to the workers once instead of duplicating them for each spectrum turned out to be slightly
more costly in terms of CPU time finally (?).
- fitspy.core.utils_mp.fit(spectrum_)
Fitting function used in multiprocessing
- fitspy.core.utils_mp.initializer(queue_incr)
Initialize a global var shared btw the processes and the progressbar
- fitspy.core.utils_mp.fit_mp(spectra, ncpus, queue_incr)
Multiprocessing fit function applied to spectra