Intensity rescaling
The intensity rescaling process aims at homogenizing the gray level histograms between consecutive images. For stacks with areas of same material along the z-axis a dedicated process named intensity_rescaling_area can be used (see below).
To achieve this, a reference histogram is defined, corresponding either to the average histogram across all slices or to a running average along the slices (z-axis).
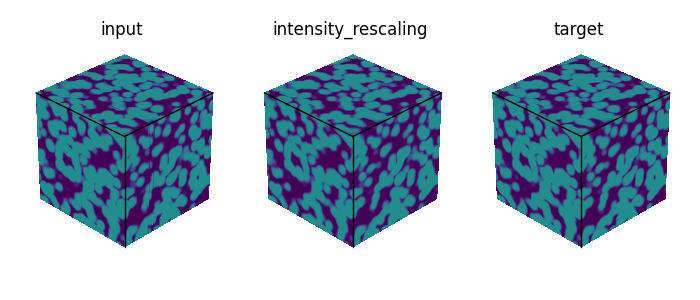
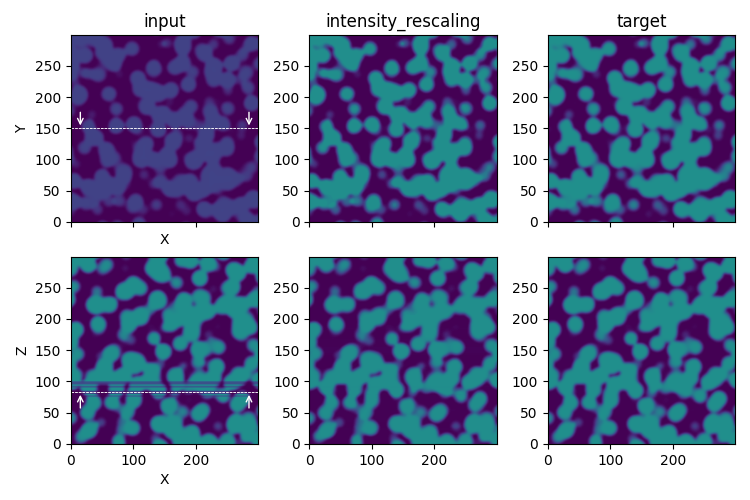
Illustration of the intensity_rescaling process step in the synthetic test case. The Z cut-plane (taken at Z=83) corresponds to a slice with a strong change in contrast.
[intensity_rescaling]
nbins = 256
#range_bins = [0, 127]
filter_size = -1
nbins corresponds to the number of bins associated to the histograms.
range_bins defines the range of the gray values to be considered for the binning.
If this parameter is not specified, then a preliminary loop on all the slices are performed to determine the min and max values associated to the full stack, leading to range_bins = [min, max].
filter_size is related to the running averaging for determining the reference histograms.
A positive integer value is associated to the number of slices/frames to consider in the running average.
filter_size = -1 corresponds to an averaging performed across all slices.
Note
In the case of areas with the same material along the z-axis (thus assumed to have a uniform gray level), a dedicated process named intensity_rescaling_area can be called.
[intensity_rescaling_area]
area = [0, 99999, 0, 99999]
threshold_min = 0
threshold_max = 99999
factors_range = [0.8, 1.2]
area refers to the [xmin, xmax, ymin, ymax] image coordinates to be selected (in pixel, according to the standard coordinates system with the origin located in the bottom left). threshold_min and threshold_max are used to define the range of values to work with and factors_range to bound the rescaling factor applied to the image values.
The related plotting associated with intensity_rescaling_area corresponds to the gray levels means in the selected area (means.png) and the calculated rescaling factors (factors.png)
Plotting
The special plotting related to the intensity_rescaling process step generates images in the dedicated outputs folder that are named intensity_rescaling_profiles.png and intensity_rescaling_maps.png.
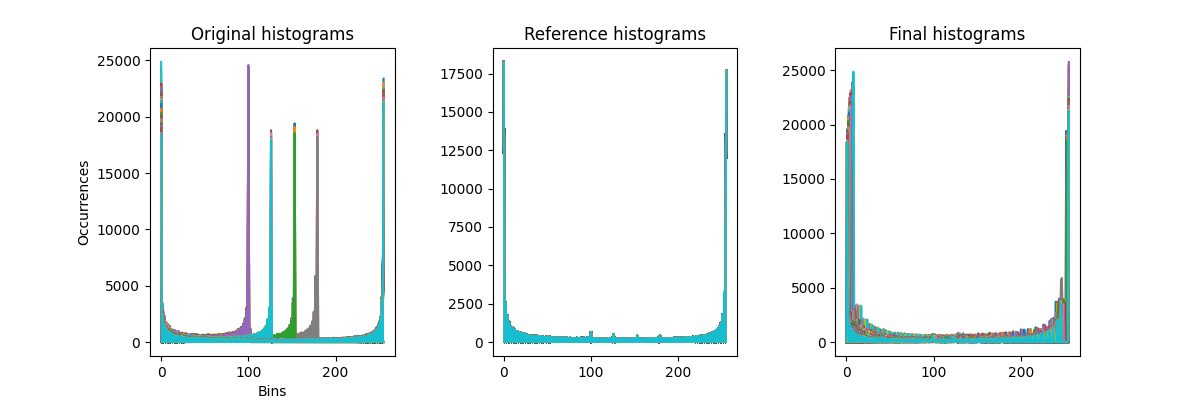
intensity_rescaling_profiles.png gives the histograms profiles calculated for each slice.
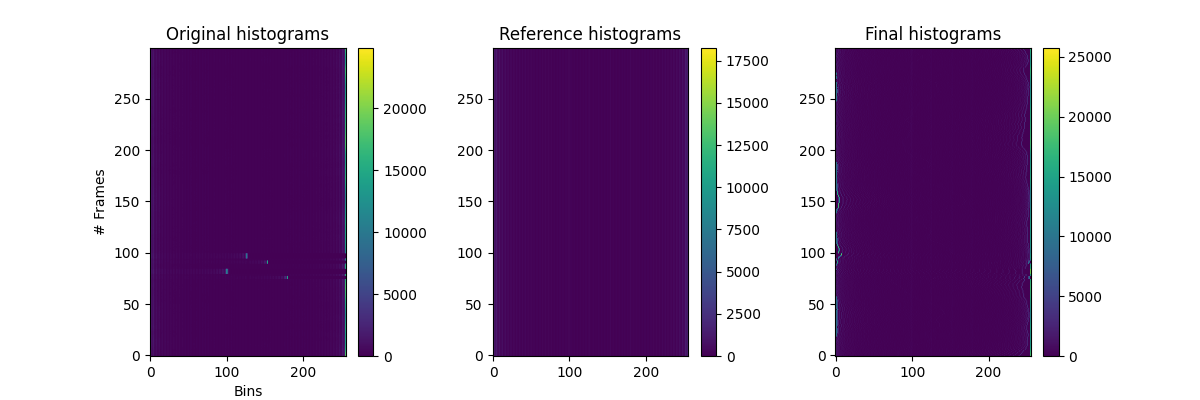
intensity_rescaling_maps.png returns the same information but according to intensity maps along the z-axis.
Note that in the map representation the maximal intensity values of the 2D-histograms are mainly hidden by the y-axis (except for slices in [70-100] of the Original histograms).