Outputs
Fitspy provides two types of outputs:
those related to the models,
and those related to the fits (parameters of the fitted models and statistics).
Outputs models
The output models consist of .json files in which all parameters of the spectrum and spectra objects have been saved so as to be able:
either to recreate the previously obtained results identically
or to apply the first spectrum model to other data sets (without considering the
fnamevalue):{ "0": { "fname": "../examples/data/spectra_2/spectrum_2_1.txt", "range_min": 200.0, "range_max": 957.299, "normalize": true, "normalize_range_min": 670.0, "normalize_range_max": 700.0, "models_labels": ["", "Peak IV", "Peak II", "", "", "Peak I", "Peak III", "", ""], "bkg_model": null, "fit_method": "Leastsq", "fit_negative": true, "max_ite": 200, "attached": true, "baseline": { "points": [[201.1400035483871, 954.8547838709676], [164.91378720565154, 228.197032967033]], "mode": "Linear", "order_max": 2, "distance": 100, "sigma": 0, "attached": true, "is_subtracted": true }, "models": { "0": { "Lorentzian": { "ampli": { "value": 377.8408958125738, "min": 0, "max": Infinity, "vary": 1, "expr": null }, "x0": { "value": 342.94548419455225, "min": 322.195, "max": 362.195, "vary": 1, "expr": null }, "fwhm": { "value": 2.643513972868272, "min": 0, "max": 200, "vary": 1, "expr": null } } }, "1": { "Lorentzian": { "ampli": { "value": 98.30555093353449, "min": 0, "max": Infinity, "vary": 1, "expr": null }, ... }, ...
Fit results
Once fitted, a spectra data set can generate several files related to the fitting statistics and the fitted parameters.
In a ‘results’ directory (to be specified by the user), the statistics files are built when clicking on Save Results in the GUI, according to the following model: {spectrum basename}**_stats.txt** file).
The same for the fitted parameters attached to each spectrum: {spectrum basename}**.csv** file)
Example of statistics returned in ordered_map.txt X=1757.0 Y=65_stats.txt (obtained from examples/ex_gui_users_defined_models_2d_map.py):
[[Fit Statistics]]
# fitting method   = leastsq
# function evals   = 93
# data points      = 575
# variables        = 17
chi-square         = 112158.281
reduced chi-square = 201.000503
Akaike info crit   = 3066.14539
Bayesian info crit = 3140.16968
R-squared          = 0.97525302
[[Variables]]
m01_ampli:  914.225148 +/- 10.5474510 (1.15%) (init = 950.0121)
m01_fwhm:   9.56464045 +/- 0.20679661 (2.16%) (init = 9.594399)
m01_x0:     520.183187 +/- 0.05449477 (0.01%) (init = 520.1866)
m02_ampli:  25.7308415 +/- 3.15171955 (12.25%) (init = 44.85308)
m02_fwhm:   89.0443082 +/- 20.7241979 (23.27%) (init = 88.40916)
...
slope:     -0.01339502 +/- 0.00379213 (28.31%) (init = -0.01434605)
intercept:  35.2928118 +/- 2.39248326 (6.78%) (init = 35.87932)
[[Correlations]] (unreported correlations are < 0.100)
C(slope, intercept)     = -0.8110
C(m02_fwhm, intercept)  = -0.6385
C(m04_fwhm, m04_x0)     = +0.6378
C(m01_fwhm, m05_x0)     = +0.5982
C(m01_fwhm, m05_fwhm)   = -0.5258
C(m05_fwhm, m05_x0)     = -0.5191
...
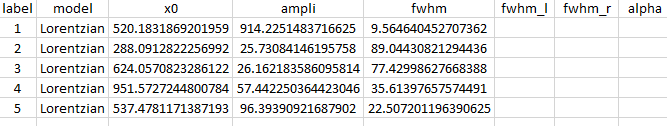
Example of the fitted parameters in ordered_map.txt X=1757.0 Y=65.csv:
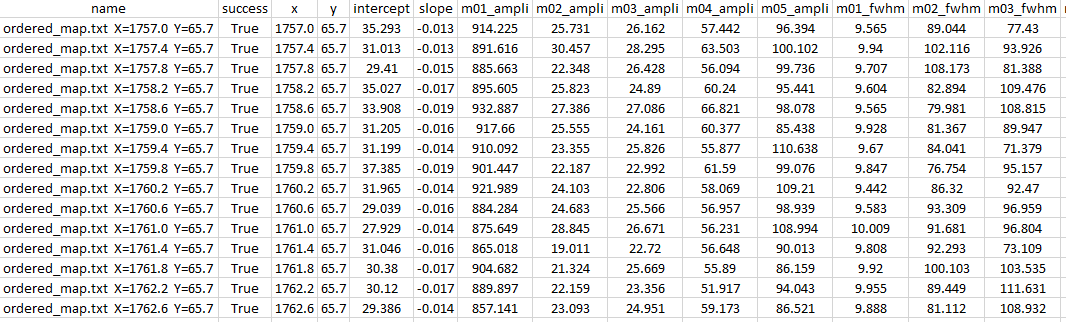
Also, a file, named results.csv, that concatenates all the parameters (ordered by names) of all the fitted spectra, is automatically generated when clicking on Save Results in the GUI.
Example of results.csv (extract):
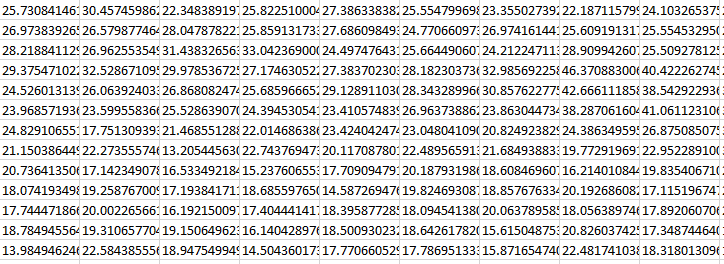
Finally, when dealing with 2d-map spectra, the button Export enables to write the current displayed data in a .csv file as: {spectrum basename}_{parameter name}_{label}.csv file.
Example of ordered_map_ampli_2.csv (extract):