Settings
Settings & Preferences
Access the Settings menu via the gear icon in the main toolbar.
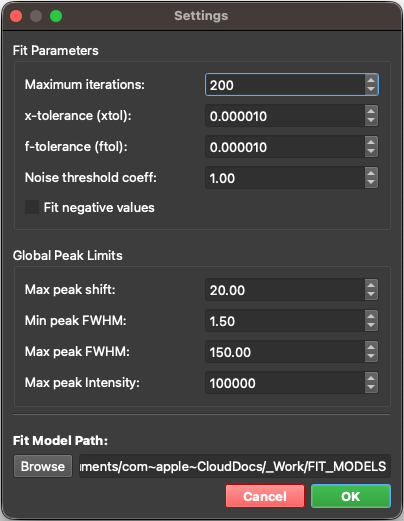
The Settings Panel is organized into three sections: Fit Parameters, Global Peak Limits, and Fit Model Path.
1. Fit Parameters
These parameters control the behavior of the Vectorized Batch Fit (VBF) engine — the mathematical optimizer that performs curve fitting on your spectra. Adjusting these values directly affects fitting speed, precision, and convergence.
| Parameter | Setting | Default | Range | Description & Behavior |
|---|---|---|---|---|
| Maximum Iterations | max_ite |
200 | 1 – 10,000 | The maximum number of Levenberg-Marquardt iterations per spectrum. • Lower (50–100): Faster fitting for previews. • Higher (200+): Better convergence for complex spectra. |
| x-tolerance | xtol |
1×10⁻⁴ | 1×10⁻⁶ – 1×10⁻¹ | Relative tolerance for the parameter step size. Convergence requires: mean(|δp| / |p|) < xtol |
| f-tolerance | ftol |
1×10⁻⁴ | 1×10⁻⁶ – 1×10⁻¹ | Relative tolerance for the cost function. Convergence requires: |costn - costn-1| / |costn| < ftol |
| Noise Threshold Coefficient | coef_noise |
1.0 | 0 – 100 | Multiplier for the auto-estimated noise level (coef_noise × estimated noise amplitude). Masks noisy data and suppresses ghost peaks.• 0: Disabled • 0.5–1.0: Conservative • 1.0–2.0: Moderate (Default) • 3.0+: Aggressive Note: You can refer to the noise level displayed in the toolbar or activate the "Show noise level" checkbox within the View Options of the SpectraViewer to see the noise level directly on the spectra plot. |
| Fit Negative Values | - | Unchecked | - | When checked, negative intensity values are included in the fit. When unchecked, they are assigned zero weight. |
Note: A spectrum is considered converged only when both
xtolandftolcriteria are simultaneously satisfied.
2. Global Peak Limits
These parameters define absolute boundary conditions that are applied globally to all peaks across the application. When you add a new peak to a fit model, these limits are used to set the initial parameter bounds automatically.
Note: You can check the "Limits" checkbox under the
PeakTableto display the actual bounds of each peak.
| Limit | Default | Range | Description & Constraint |
|---|---|---|---|
| Max Peak Shift | 20 | 0 – 100 | Maximum allowed displacement of a peak center (x0) from its initial value. x0 - maxshift ≤ x0fitted ≤ x0 + maxshift |
| Min Peak FWHM | 0.1 | 0.01 – 500 | Minimum allowed Full Width at Half Maximum (FWHM). Prevents peaks from collapsing into delta-function artifacts. |
| Max Peak FWHM | 200 | 1 – 1,000 | Maximum allowed FWHM. Prevents peaks from broadening into flat baselines. |
| Max Peak Intensity | 100,000 | 1 – 1×10⁹ | Upper bound for peak amplitude. Prevents unrealistically high intensity values. |
3. Fit Model Path
Specify the default storage directory for your custom fit models (saved in JSON format). The application will automatically scan this folder and load all available models for easy selection in the Fit Model Builder interface.
Click Browse to select a folder, or type the path directly.